End-to-end design and installation of electrical energy monitoring systems — from meters and signal-aggregation panels to dashboards and alerts — by a team that has built monitoring and SCADA systems for over 30 years.
Power Monitoring is a system that measures and records a factory's electrical energy use in real time — power (kW), energy (kWh), power factor, and power quality — and presents it on a dashboard that shows the whole plant at a glance.
When you can actually "see" which department, machine, and time period is drawing power, you can manage energy cost with data instead of guesswork — the first step toward cutting electricity bills and building an energy management system to the ISO 50001 standard.
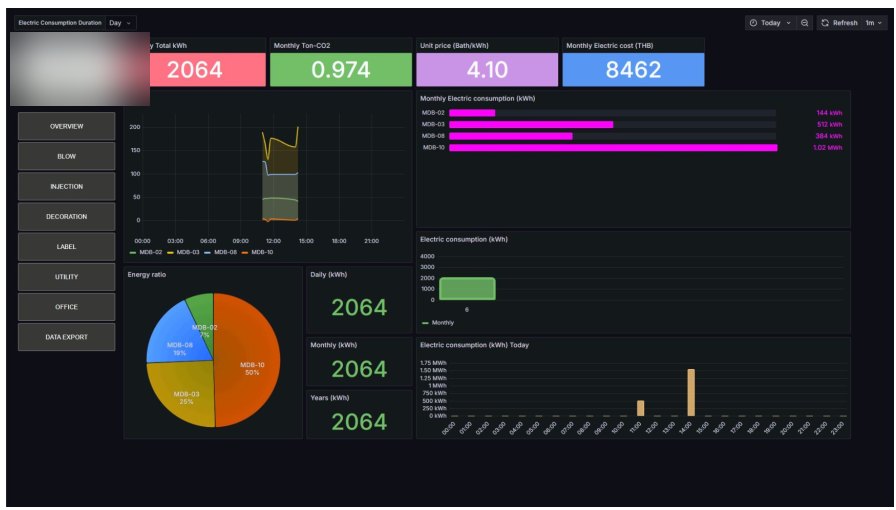
End to end — from site survey and metering-point design to meter installation, communication network, dashboards and reports.
Survey the actual MDB/DB panels and design where to measure (main incomer, production lines, key machines) to get data you can act on.
Install power meters and current transformers (CTs) to standard, with minimal disruption to production.
Connect meters via Modbus RTU/TCP into a gateway/PLC and aggregate the data to a server or the cloud.
Design real-time energy screens with historical views, period comparisons and drill-down by measurement point.
Set alerts when usage exceeds thresholds or power quality is abnormal, with automated daily/monthly reports.
Split electricity cost by department/production line/tenant to work out a true cost per unit produced.
Find abnormally high loads, idle-running machines and peak periods so you can adjust operation and reduce demand charges.
Allocate power by department/line so you know exactly how much energy each product carries.
Detect voltage sags, harmonics and low power factor that drive up penalties and damage equipment.
Real-time anomaly alerts reduce the risk of unexpected outages and machine stoppages.
Real, historical energy data ready to build into a standards-based energy management system.
Link energy data to production systems to analyze efficiency (OEE) and sustainability.
From installing power meters and gateways to measuring and testing the system at the actual factory MDB — all by the APY team.
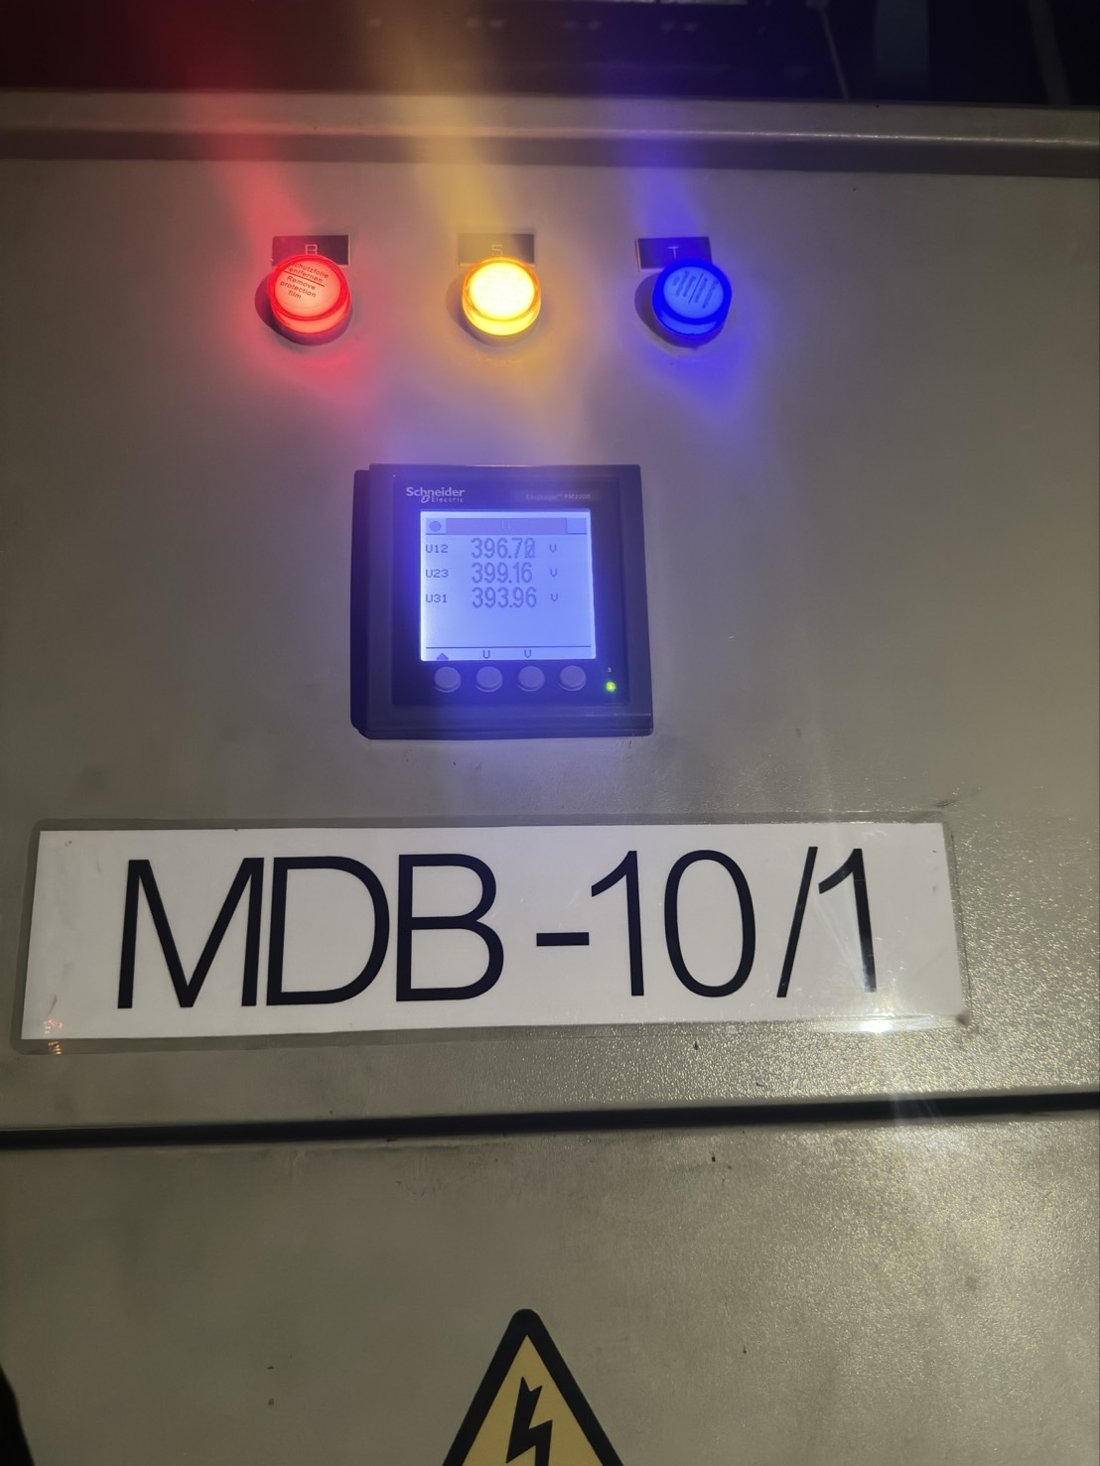
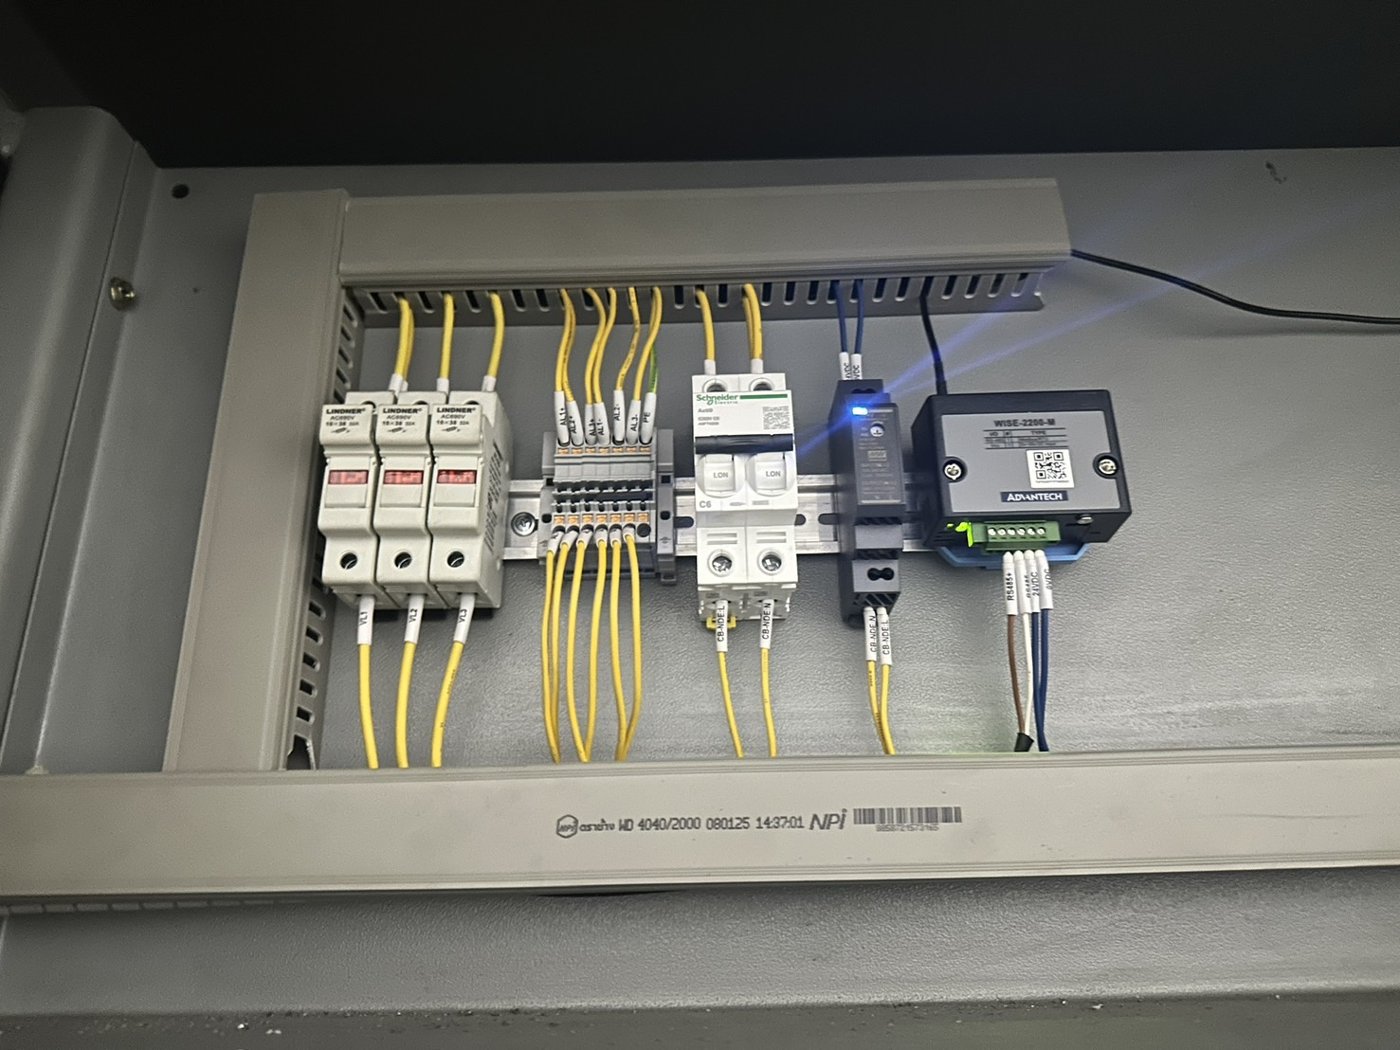
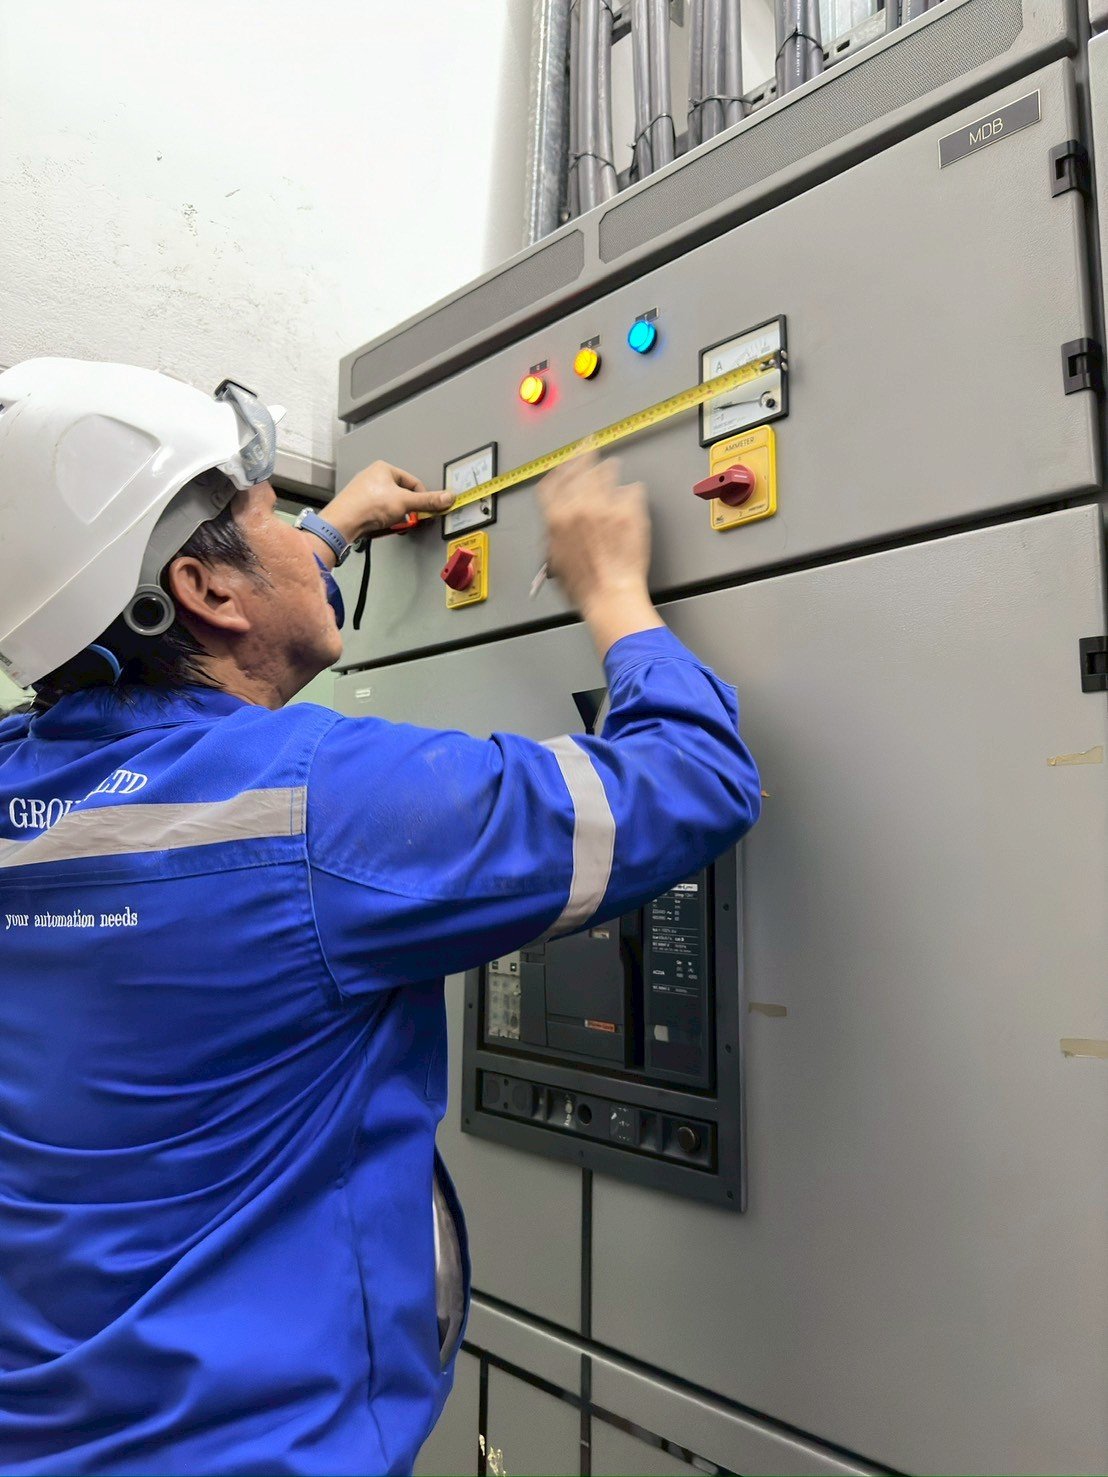
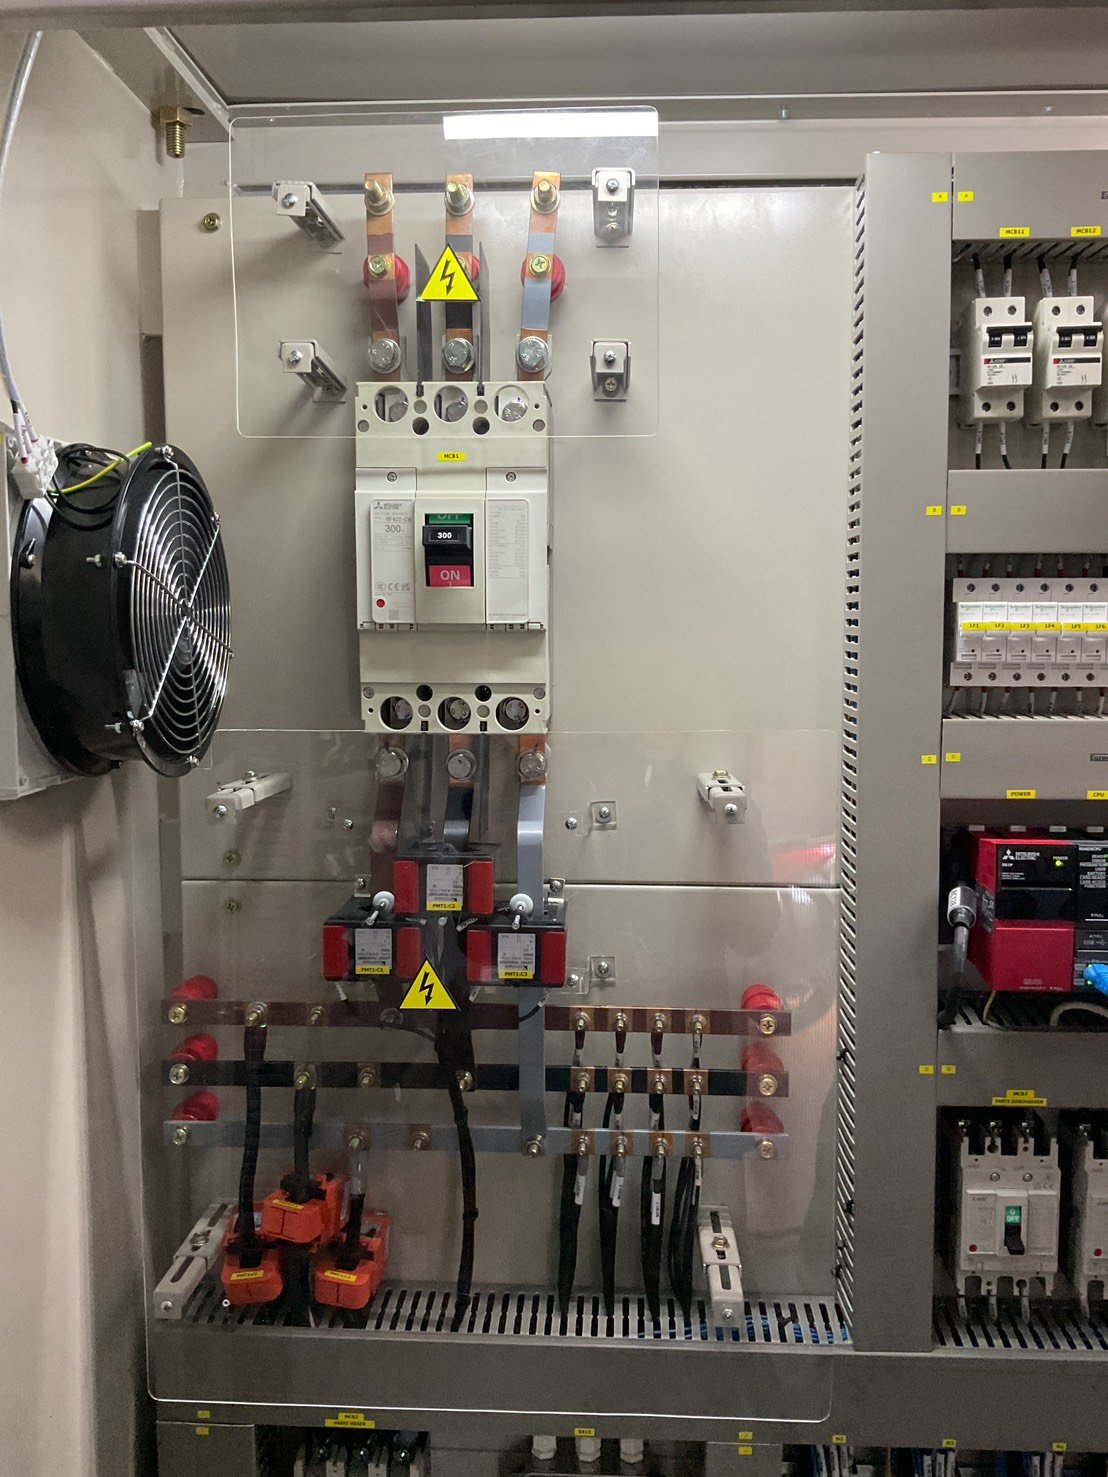
We can integrate power meters from many brands (Schneider PowerLogic, Socomec, Accuenergy, Mitsubishi and others) over standard protocols, then bring them together on a SCADA/dashboard we design ourselves — brand-independent, choosing whatever is most cost-effective for your plant.
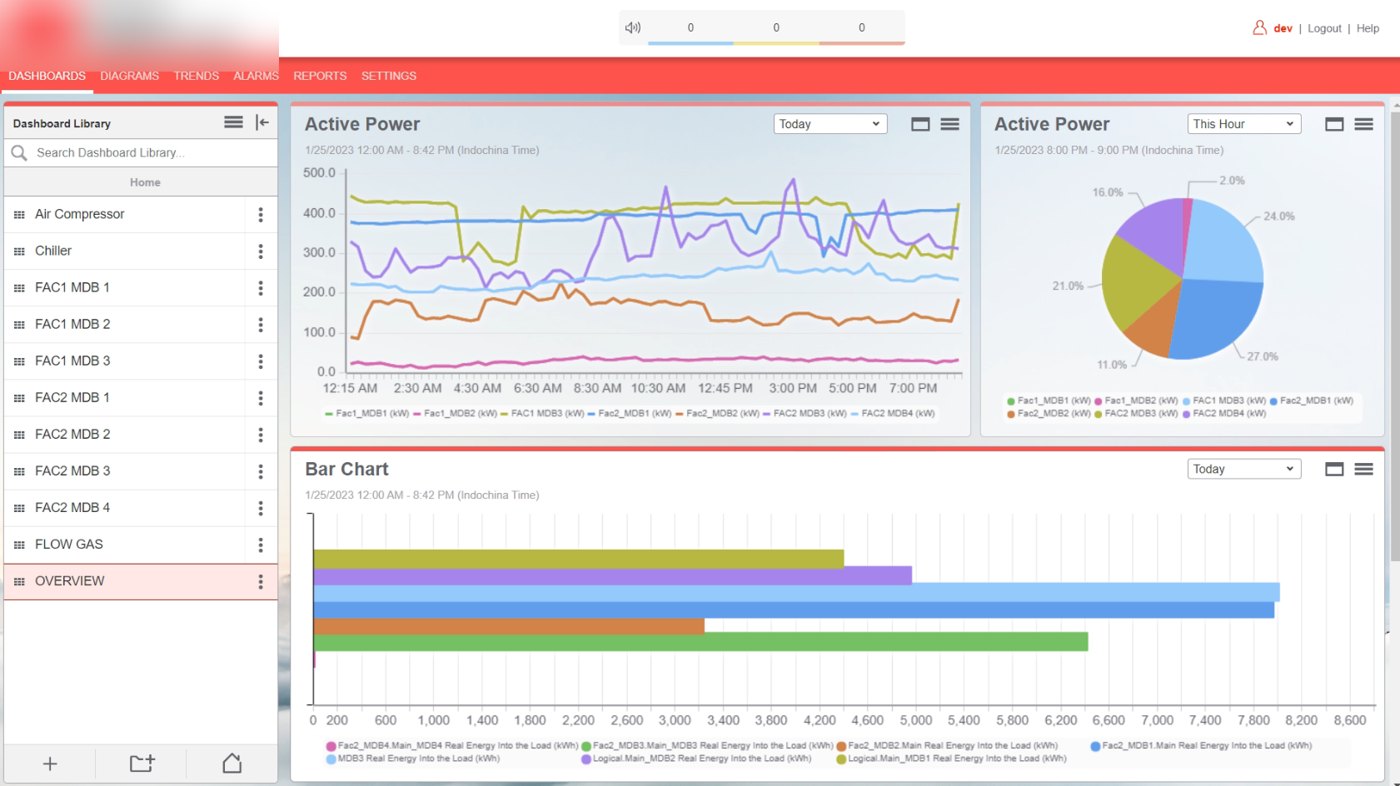
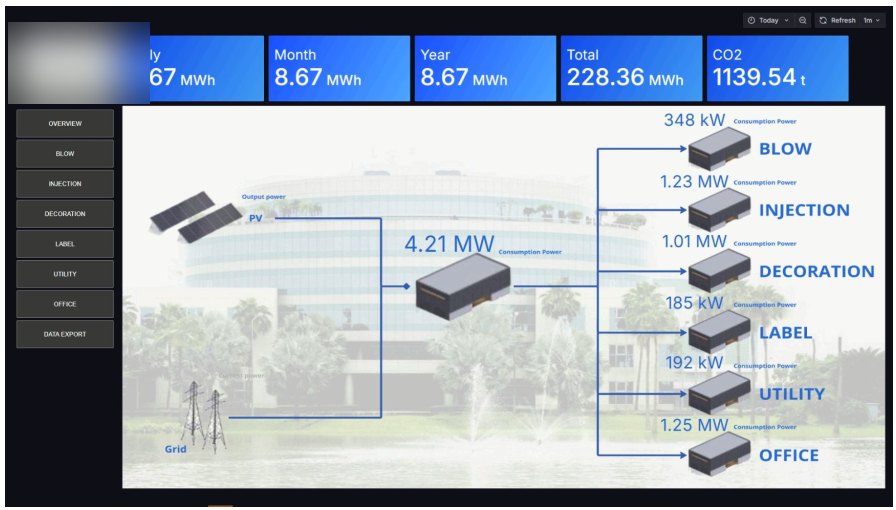
Reference examples:
• Leading industrial factory — multi-point power monitoring aggregated into a single dashboard, with per-department energy reports
• Integrated with a SCADA system — energy data linked to production monitoring, giving a single view of both production and energy
Want to see work similar to your plant? Talk to our engineering team
One team that handles both on-site meter installation and dashboard/SCADA design.
Survey, design, install, integrate, test and maintain — all within one team.
A Thailand-based team with 30+ years of experience, ready on site when you need us.
Tell us about your factory and electrical system. We'll reply within one business day with a practical Power Monitoring approach.
Free Consultation APY PREMIUM GROUP